
LOST IN SPACE: A NARRATIVE LAUNCHED ON HYPE (ASTS, RDW, SPCE, SIDU, MNTS, RKTO)
Asteroid mines, microgravity strawberry crops, low-orbit data centers, lunar real estate, and a bunch of wishes all floating in the universe of make-believe.
Executive Summary
The publicly traded space sector is not an industry but a collection of dreams that are too absurd to actually come true. The commercial space sector now sits above $500 billion in market value, yet most of it is concentrated in companies that generate little cash, rely on continuous dilution and capital raises to survive, and depend on technological milestones still decades from commercial viability.
A parade of capital-intensive thought experiments has plagued the industry, ranging from asteroid mining and lunar real estate to orbital data centers. While often presented as transformative business opportunities, these concepts frequently lack a compelling economic rationale beyond the story itself. Rather than solving meaningful problems more efficiently than Earth-based alternatives, they introduce enormous costs, operational hurdles, and uncertain demand, all while offering little evidence of a defensible competitive advantage. The result is an ecosystem where compelling narratives often receive more attention than basic questions of economic viability.
Three catalysts will close the price-to-reality gap. First, the SpaceX drain: generalist capital exits proxy positions to own SPCX directly, removing the single largest source of speculative demand from the public names. Second, the hardware reckoning: the New Glenn explosion reminded a retail-dominated shareholder base that rockets are not software. Hardware failures destroy expensive assets instantly and set timelines back by months, years, or permanently; such was the case with the Concorde, which was forever grounded. Third, the dilution spiral: pre-revenue companies burning hundreds of millions annually will repeatedly return to equity markets on progressively worse terms until they cannot do so.
The sector’s valuation FOMO rests on a single event horizon… the SpaceX IPO. The smart money consensus is to buy the public proxies before the private giant goes public and exits into the IPO. SpaceX is already priced at $135 per share, implying a $1.75 trillion valuation. The space sector has followed the same familiar pattern as the AI boom and EVs: a genuine technological opportunity, a very long timeline, a market that collapses that timeline to zero, and a financial reckoning when reality hits. The space stocks covered in this short report are highly likely to become defunct in the near- to long-term. Past hypomanias, such as the 1999 dot-com boom-and-bust, serve as examples. From the internet mania, very few stocks actually ended up doing anything in the long term. Almost all of those who went along for the ride soon ended up with little to no return on investment.
Fugazi Research believes the sector’s current valuations bear little resemblance to the economic realities of the underlying businesses and considers the majority of publicly traded space-sector companies to have no fundamental value.
Fugazi Research Analysis
The sector’s entire valuation was built on a single assumption (that SpaceX’s inevitable IPO would re-rate the public proxies upward); however, this is about to be proven otherwise when SpaceX begins trading under SPCX, giving capital direct access to the only space company with actual revenue, actual launch dominance, and actual recurring cash flows, eliminating the structural reason to hold any of the six companies in this report at any premium above their standalone fundamental value.
The sector’s combined market capitalization of $33.2 billion rests on $361 million in combined trailing revenue, of which $295 million belongs to a single company (ASTS) that trades at 95x those revenues, leaving the remaining five with $66 million in combined sales against a $5.24 billion collective market cap, a combined price-to-sales ratio of 79 times against a sector median of 4.4 times, which showcases capitalized wishes instead of true growth premiums.
The sector’s primary revenue model is not commercial operations but the recycling of capital from public shareholders through related-party structures, government contracts with no path to commercial scalability, and one-time engagements that management describes as pipelines and projected recurring revenue but whose primary source filings reveal as single-customer dependencies that collapse the moment one contract ends.
Every company in this cohort carries a going concern qualification, a material weakness disclosure, or a formal auditor warning about the adequacy of capital to fund twelve months of operations, and every one of them has responded not by generating revenue, but by issuing more shares. A recurring and red-flag-raising pattern across the majority of the space sector.
The sector’s business plan portfolio reads as a list of sci-fi wishes rather than a collection of investable commercial opportunities: asteroid mining operations targeting metallic rocks twenty-two million miles from Earth with a combined success rate of zero missions across three attempts; microgravity pharmaceutical crystal growth for drug companies that have not confirmed commercial orders; orbital data centers whose theoretical latency advantages exist in no anchor tenant agreement or signed contract visible in any SEC filing; lunar real estate conveyed under legal frameworks no sovereign government has ratified; and, as of June 4, 2026, a contract to grow strawberries aboard the International Space Station for a Luxembourg biotech company whose founder’s stated ambition is to taste Earth from Mars.
The single most reliable financial signal in the publicly traded space sector is not revenue growth, backlog expansion, or launch cadence; it is the reverse stock split, a mechanism deployed exclusively by companies whose share price has declined to levels triggering Nasdaq delisting requirements and which accomplishes nothing operationally while resetting the clock on the next round of dilution at a higher nominal price.
Fugazi Research has reviewed the filings, the mission statements, the backlog disclosures, the related-party footnotes, the going concern qualifications, the reverse split histories, the ATM prospectuses, the asteroid mining roadmaps, the orbital strawberry contracts, and the press releases of companies that renamed themselves space businesses eleven days before publication, and from all this we have come to the following conclusion: the publicly traded space sector, in aggregate, is not an industry in the conventional sense of the word but a capital recycling mechanism dressed in the aesthetic of human ambition, sustained by retail enthusiasm, narrative momentum, and fundamental valuation that, if taken in all seriousness, amounts to zero.
Financial Summary
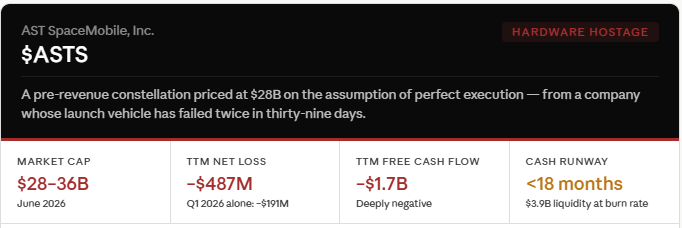
ASTS (AST SpaceMobile): Despite $3.9B in cash, the company is a cash-burning machine, spending $191M net loss in Q1 2026 alone. Shelf registrations enable massive future dilution; launch delays cast doubt on 2026 guidance; current valuation ($28B+) assumes flawless execution of an unproven business model.
ASTS reported Q1 2026 revenue of $14.7 million against analyst consensus of $37 million (a 60% miss) and a loss of $0.66 per share against consensus of $0.20, then reaffirmed full-year 2026 revenue guidance of $150 to $200 million without reduction.
ASTS at $27.96 billion in market cap against $150 to $200 million in 2026 guidance implies a forward P/S of 140x to 186x, which is higher than the trailing multiple, because the stock has outrun even management’s own optimistic revenue ramp.
ASTS’s outstanding shares increased by 69% over the past year, a major risk for analysts, while the company simultaneously requires average annual earnings growth of 57% to meet consensus 2027 profit forecasts.
ASTS at 4.4 times its own 2026 guidance midpoint of $175 million implies a market cap of $770 million, compared with a current market cap of $27.96 billion (a 97.2% decline).
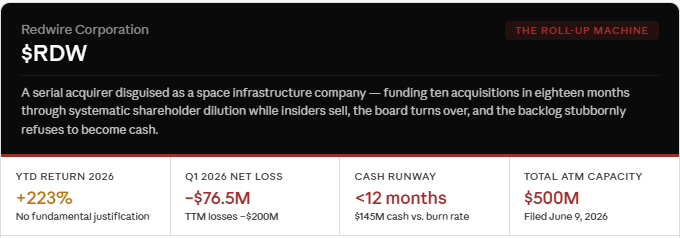
RDW (Redwire Corporation) is a rollup machine with governance dysfunction, systematic shareholder dilution through a combined $850M ATM, insider selling, and a CEO executing acquisitions while the cash runway compresses. The board lacks continuity; the company is subject to ongoing securities litigation.
SPCE at 4.4 times its consensus 2026 revenue estimate of $33.3 million implies a market cap of $146 million against $190 million, and that math uses an estimate that has been revised downward 86.67% in three months and requires commercial flights to begin in five months from a vehicle that has completed one unpowered glide test.
SPCE (Virgin Galactic), meanwhile, carries a consensus analyst revenue estimate for Q2 2026 of $244,800, a number that has been revised downward 86.67% in the past three months alone. From a company that has guided the commercial flight commencement in Q4 2026 for four consecutive years.
SIDU at 4.4 times its $9 million 2026 analyst revenue forecast implies a market cap of $39.6 million, down from $381 million (an 89.6% decline in the company’s current valuation).
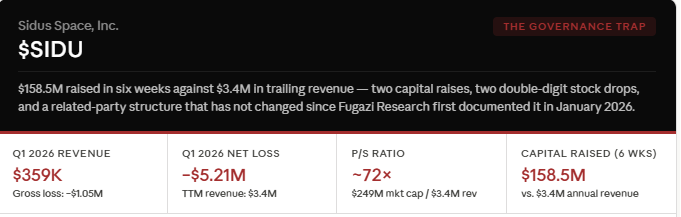
SIDU (Sidus Space): Too many pivots, trivial revenue ($3M annually), and astronomical valuation multiples (72x P/S). The company raised $100M in June 2026 and will need more (shareholders face chronic dilution from a company that has not demonstrated a viable business model)
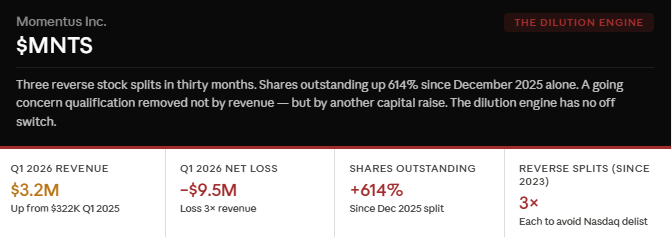
MNTS (Momentus Inc.) presents the sector’s cleanest mathematical proof that analyst forward revenue estimates are disconnected from any primary-source reality: the forecasted annual revenue for Momentus in 2026 is $167 million, against trailing twelve-month revenue of $1.1 million and a business whose entire Q1 revenue improvement was driven by NASA engineering services and hosted payload work that its own filings describe as project-based and non-recurring. Shares outstanding rose from 2.2 million to 10 million between Q4 2025 and Q1 2026 (a 355% increase in a single quarter) driven entirely by equity raises rather than business self-sufficiency, while the improved balance sheet was characterized by analysts as a function of financing activity, not operational cash generation.
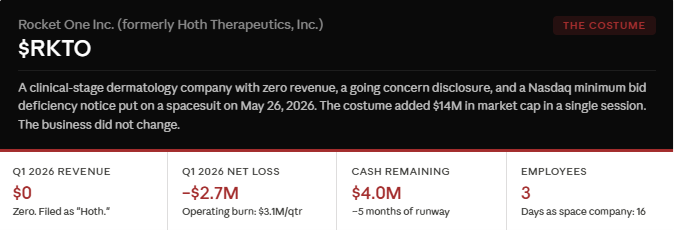
RKTO (Rocket One), which just 2 weeks ago was known as Hoth Therapeutics, formerly a clinical-stage dermatology company with no approved products, which now contributes to this Financial Summary the only data points that matter for a company with zero revenue, zero space operations, and a going concern disclosure filed eleven days before its space sector rebrand: cash and cash equivalents of $4,047,198 as of March 31, 2026; accumulated deficit of $75,571,808; net cash used in operating activities of $3,050,000 in Q1 2026 alone; and an explicit going concern qualification stating the company does not believe its current cash is sufficient to fund operations.
The definitive quantitative verdict on the publicly traded space sector, the number that requires no valuation model, no forward estimate, and no analytical framework beyond arithmetic, is the combined accumulated deficit of the six companies in this report: $4.72 billion in losses recorded since inception, against $361 million in combined trailing twelve-month revenue, a ratio of $13.08 destroyed for every single dollar ever collected from a paying customer across the entire cohort’s collective public market history.
At current market prices, the six companies in this report require their combined forward revenue to grow by a factor that has no precedent in the history of publicly traded aerospace and defense. Even the most optimistic analyst scenarios, when stress-tested against primary-source execution records, yield price targets implying material downside from current levels.
WHEN THE DUST SETTLES
Nine days before SpaceX began trading on the Nasdaq, Morningstar published the most important sentence written about the space sector this decade. It did not concern AST SpaceMobile (ASTS), Redwire (RDW), Virgin Galactic (SPCE), Sidus Space (SIDU), Momentus (MNTS), or Rocket One (RKTO). It concerned SpaceX itself.
“We think the company has been significantly overvalued and investors will have opportunities to buy the stock at more attractive levels after the IPO.”
Morningstar valued SpaceX at $63 per share (a 53% discount to the IPO offering price of $135), arriving at that figure not through skepticism but through mathematics, constructing three probability-weighted scenarios, and concluding that even giving SpaceX the benefit of the doubt in several key forecasts, only the most optimistic moonshot scenario approaches the IPO offering price.
Morningstar’s lead analyst Nicolas Owens wrote that SpaceX’s economic moat is “indeterminate” and that xAI poses a “material threat of value destruction” to the company, the private AI venture that Elon Musk controls separately and which competes directly with Starlink for the orbital computing market, upon which every space sector bull thesis depends.
What follows is the forensic record of what happens when the sugar rush ends, not for SpaceX, which has the revenue, the technology, and the launch cadence to survive a valuation correction, but for the six companies that borrowed SpaceX’s halo without its fundamentals and built $33.2 billion in combined market capitalization on $361 million in combined revenue, $4.72 billion in combined accumulated losses, and the collective assumption that proximity to the narrative was the same thing as participation in the business.
Aside from that, there is the crowding-out effect resulting from capital rotation in a market where SpaceX itself is now directly purchasable at a price that Morningstar already considers overvalued, making every proxy position simultaneously redundant and out of consideration for true investors. This is firstly damning for ASTS, which trades at approximately 260 times forward revenue on a direct-to-cell satellite broadband thesis, the precise market that Starlink is pursuing with 10,000 satellites, $11.3 billion in annual revenue, 39% operating margins, and the lowest launch costs in human history, not one of the six companies in this report appears in all of the institutional-grade analysis dedicated specifically to identifying investable alternatives to a SpaceX position.
THE BLOWUP RISK: Why a Single Explosion Exceeds the Market Cap of Four Companies in This Report

Source: 2026 New Glenn Rocket Explosion. Cape Canaveral Launch Complex 36. May 28, 2026.
The publicly traded space sector has spent seven years arguing that rocket launches are infrastructure events, routine, scalable, replicable, and ultimately subject to the same cost-curve dynamics that governed cloud computing, electric vehicles, and mobile broadband. On May 28, 2026, at approximately 9:00 PM Eastern Time at Cape Canaveral Launch Complex 36, that argument received its most expensive counterargument to date. Blue Origin’s New Glenn rocket exploded during a static fire test (a routine pre-launch engine ignition conducted while the vehicle remains anchored to the ground), destroying the booster and severely damaging Launch Complex 36, Blue Origin’s only operational New Glenn launch site. The explosion was believed to be the most powerful rocket explosion since the Soviet Union’s N1 moon rocket was destroyed during its second launch attempt.
The financial consequences are massive, as New Glenn costs approximately $2.5 billion to develop and manufacture, and each launch costs between $68 million and $100 million. Blue Origin spent more than $1 billion rebuilding Launch Complex 36 prior to the explosion (the facility that is now destroyed). The combined replacement cost of a new rocket, a rebuilt launchpad, and a reconstituted launch manifest places the total event cost conservatively above $3.5 billion. For context: that single static fire test failure cost more than the combined market capitalization of Virgin Galactic, Sidus Space, Momentus, and Rocket One (four of the six companies in this report), with billions remaining.
Blue Origin’s CEO, Dave Limp, publicly stated that the company will resume operations on New Glenn before the end of 2026. NASA Administrator Jared Isaacman, who visited the destroyed launchpad the morning after the explosion, told CNBC the repair timeline could extend to 2028 (a gap of approximately two years between the company’s public commitment and the government’s independent assessment)
The cascading consequences extend well beyond Blue Origin’s balance sheet. NASA’s entire lunar exploration program is now dependent on SpaceX for the foreseeable future, and promises regarding Blue Origin, which was slated to deliver lunar rovers and a human landing system for the Artemis program, NASA has been forced to seek alternative launchers for missions already under contract, as New Glenn was central to the existing timeline, threatening the entire schedule.
This is the fundamental risk that retail investors are not considering or even aware of. As we mentioned before, rocket explosions are not software failures, but hardware failures. The history of spaceflight is a history of hardware failures at the worst possible moments, at costs that exceed the entire capitalization of the companies in this report, on timelines that compress against regulatory deadlines and customer commitments simultaneously. The sector’s entire forward revenue model assumes that launch vehicles will be available, functional, and on schedule. The historical record of spaceflight establishes that this assumption fails regularly, expensively, and without warning. The financial consequences of each failure are measured in billions of dollars and years of delay, while the market capitalizations of the companies in this report range from hundreds of millions to tens of billions of dollars.
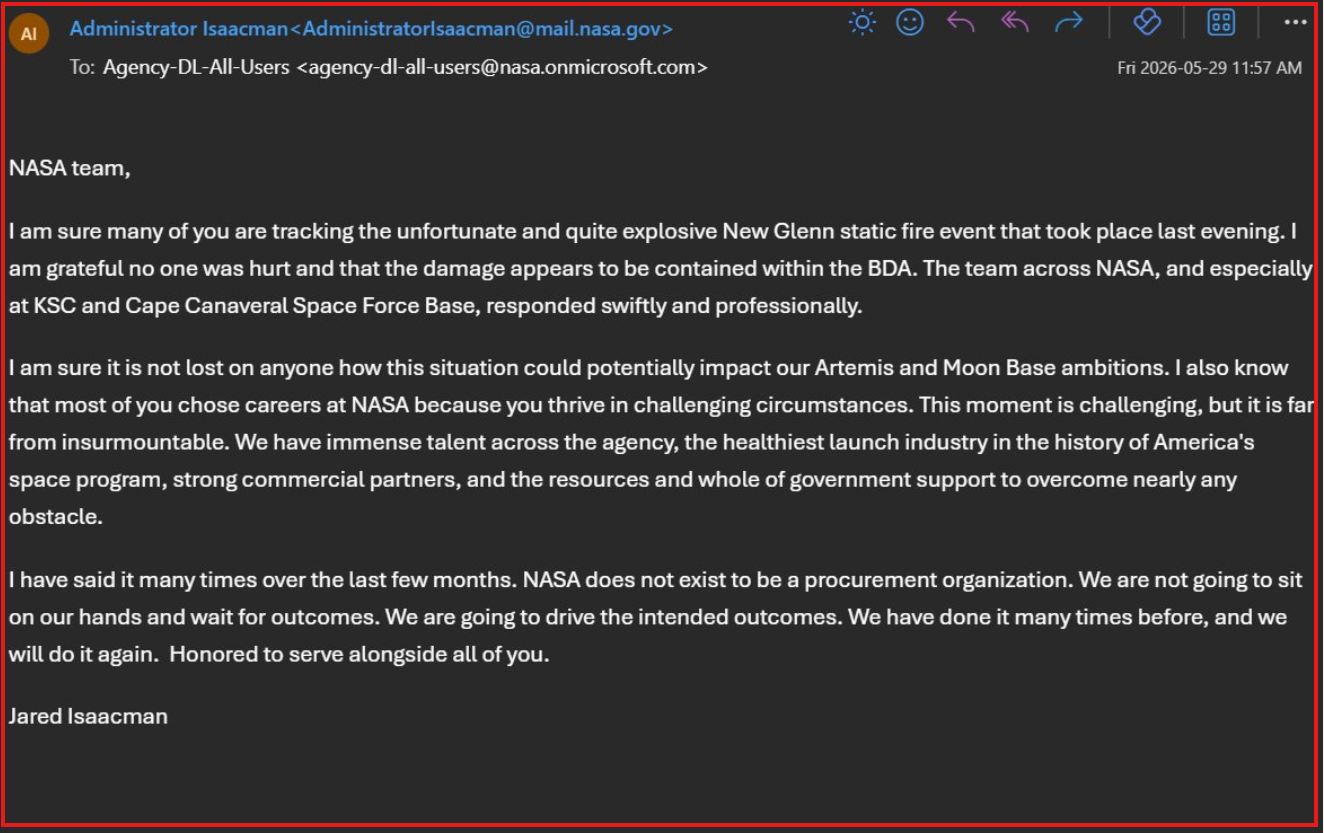
A message from NASA Administrator Jared Isaacman to the NASA workforce
Source: 2026 New Glenn Rocket Explosion. Cape Canaveral Launch Complex 36. May 28, 2026.
THE USUAL SUSPECTS
What follows is not a collection of investment opinions but a forensic record of six publicly traded companies that collectively represent every structural failure mode available in a capital market driven by hype and narrative. Each company is distinct in its particular species of dysfunction: one is a governance trap, one is a dilution engine, one is an eternal promise, one is an absurdist science project losing a quarter-billion dollars annually, one is a binary hardware bet whose launch vehicle keeps exploding, and one is a failed dermatology company that put on a spacesuit eleven days before this report was written.
AST SpaceMobile, Inc. (ASTS)
ASTS is a pre-revenue cash-burning machine priced at $28B on the assumption of perfect execution. Launch delays, cash-burn acceleration, and shelf registration dilution are all risks that could trigger a sharp re-rating. ASTS is the most liquid vehicle for shorting the space bubble.
Cash Burn Reality
AST SpaceMobile reported a net loss of $191M in Q1 2026, with operating expenses of $164.1M and property/equipment/spectrum investments of $379.3M. The trailing 12-month net loss stands at $487M, and the company is forecast to incur an additional $213M in losses over the next year.
The company holds $3.9B in liquidity as of Q1 2026, which, at current burn rates, leaves less than 18 months of cash. Analyst models show no path to positive free cash flow until 2029 at the earliest.
Launch Delays & Over-Promising
In April 2026, ASTS experienced a significant setback: the BlueBird 7 satellite failed during launch. At the same time, satellite analyst Tim Farrar of TMF Associates has been skeptical that ASTS will meet its 2026 targets, citing a pattern of delays and missed guidance.
Dilution via Shelf Registrations
ASTS has a shelf registration statement on file and recently filed an additional $166M ESOP-tied shelf registration in May 2026. The company has already increased shares outstanding by 33% over the past year and raised $460M through convertible notes. As cash burn accelerates, shelf registrations become the means of staying solvent.
Valuation
ASTS has a market capitalization of $28–36B (as of early June 2026), with cumulative losses of $487M. Wall Street analysts have a Hold consensus rating and a $74.80 price target, representing a 25% downside from current levels as of June 9, 2026.
Source: AST SpaceMobile, Inc. Form 10-Q, Quarter Ended March 31, 2026. Filed May 2026.
Source: AST SpaceMobile, Inc. Form 10-K, Fiscal Year Ended December 31, 2025. Filed March 2, 2026.
Source: AST SpaceMobile, Inc. Form S-8 Registration Statement ($166.02M ESOP). Filed May 15, 2026.
Redwire Corporation (RDW)
Redwire is a roll-up company disguised as a growth story. The reality: CEO Cannito is executing his playbook (acquire, integrate, exit), funded by systematic shareholder dilution through a total of $850M in ATM offerings. The board is weak and turning over rapidly. Governance issues (securities litigation, accounting misstatements) suggest structural problems. Cash runway is compressed to less than 12 months absent additional capital raises. The stock is trading at 7.1x sales on an unprofitable base, a valuation that assumes flawless execution in an environment where integration risk is acute.
The Valuation Disconnect
Redwire has surged, fueled by sector-wide enthusiasm ahead of the SpaceX IPO. Yet the company remains unprofitable, trading at a P/E ratio of -5.7 (negative earnings), and a price-to-sales ratio of 7.1x. For context, defense contractors with proven profitability typically trade at 2–3x sales; RDW’s 7.1x valuation is priced for a scale-up story rather than risk-adjusted returns.
RDW incurred -$200M in trailing-twelve-month net losses (driven primarily by the integration of acquisitions). Assuming a conservative 50% improvement in burn as acquisitions are integrated, the company has less than 12 months of cash runway before it must either achieve profitability or raise more capital. The company has stated that it has improved liquidity by $45M from December 2025 to March 2026, suggesting recent capital raises or operational improvements. However, this improvement comes entirely from external capital raises, not operations.
Systematic Shareholder Dilution via ATM
First, the ATM situation is worse than previously reported. The $350 million program wasn’t just authorized, it was fully exhausted and immediately replaced with a $500M program filed June 9. That’s $850M+ in combined ATM issuance in a single year.
The cumulative effect: shares outstanding have increased 94% in the past year. This is not a one-time raise; it is a rolling dilution program that erodes shareholder value with each offering. The $350M ATM represents roughly 15–20% of the current market cap, depending on the stock price. If fully deployed, it will dilute current shareholders by that percentage. Given the company’s cash burn, the full $350 million is likely to be deployed within 18–24 months.
.Management: Acquisition & Dilution Specialist, CEO
Pete Cannito, CEO since September 2021, is a seasoned roll-up executive. His prior role was CEO of Polaris Alpha (2016–2018), a company he helped form by merging three entities (EOIR, Intelligent Software Solutions, PROTEUS Technologies). Polaris was subsequently sold to Parsons in 2018
Cannito’s playbook is clear: acquire, integrate, and exit via acquisition or IPO. At Polaris Alpha, he executed this strategy and handed off to Parsons. At RDW, he is pursuing the same model: rolling up space companies, consolidating, and betting on M&A to drive growth. The problem is that this strategy works only when integrations succeed, and customer concentration risk is managed. RDW’s losses, impairments, and securities litigation suggest integration is proving difficult.
Securities Litigation & Accounting Issues
In March 2025, Redwire settled a securities class action lawsuit for $8 million. The settlement covers investors who purchased securities between March 25, 2021 (the SPAC merger announcement) and March 31, 2022. The allegations: Redwire and its executives, Peter Cannito and William Read, made materially false statements about internal controls and accounting practices.
This is a critical red flag. False statements about internal controls are not minor accounting issues; they suggest systematic problems in how the company records and reports financial information. For a roll-up company with 10 acquisitions in 18 months, internal controls are essential for managing integration risks and ensuring reliable financial reporting. The company’s false statements about controls suggest either incompetence or intentional misrepresentation.
Source: Redwire Corporation, Form 10-Q, Quarter Ended March 31, 2026. Filed May 7, 2026.
Source: Redwire Corporation, Form 8-K, Q1 2026 Earnings Press Release. Filed May 6, 2026.
Source: Redwire Corporation, Form 8-K, $500M ATM Equity Distribution Agreement. Filed June 9, 2026.
Source: Redwire Corporation, Prospectus Supplement, $350M ATM Program. Filed May 6, 2026.
Source: Redwire Corporation, Prospectus Supplement, $500M ATM Program. Filed June 9, 2026.
Virgin Galactic Holdings, Inc. (SPCE)
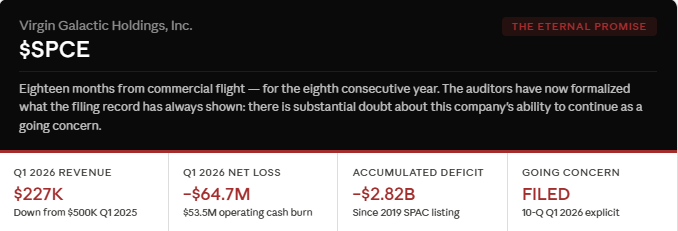
Virgin Galactic has spent $2.82 billion in accumulated losses since its 2019 SPAC listing, generating less than $15 million in cumulative revenue. The auditors have now documented what the filing record has always shown: that the Q4 2026 commercial flight timeline has been stated in every annual report since 2022. The Delta-class spacecraft has completed only ONE unpowered glide test. The company holds $250.5 million in cash against $418.7 million in debt and a $180 million burn before first commercial revenue.
The Valuation Disconnect
Virgin Galactic has spent years promising routine commercial spaceflight, yet revenue remains negligible relative to the capital consumed. The company generated only a few hundred thousand dollars of revenue in Q1 2026 while continuing to lose tens of millions of dollars per quarter. Management continues to target commercial Delta-class operations in late 2026, but the company must still prove that demand, pricing, utilization rates, and operating economics can support a sustainable business.
The balance sheet remains dependent on capital market access rather than internally generated cash flow. While investors continue to model substantial future revenue growth, the company has repeatedly extended commercialization timelines and remains years removed from demonstrating a profitable operating model.
Another overlooked risk is that Virgin Galactic’s addressable market remains largely theoretical. While management has highlighted customer reservations and long-term interest in space tourism, the company has yet to demonstrate repeat demand, sustainable flight frequency, or economics capable of supporting a large-scale operation. The business model assumes that affluent customers will continue paying premium prices for a product that remains operationally complex, weather-dependent, and subject to significant safety considerations. Even if commercial service begins as planned, investors may ultimately discover that proving demand is considerably easier than building a profitable business around it.
Source: Virgin Galactic Holdings, Inc. Form 10-Q, Quarter Ended March 31, 2026. Filed May 2026.
Source: Virgin Galactic Holdings, Inc. Form 10-K, Fiscal Year Ended December 31, 2025. Filed March 2026.
Source: Virgin Galactic Holdings, Inc. Form 8-K, Q1 2026 Earnings Press Release. Filed May 14, 2026.
Sidus Space, Inc. (SIDU)
Fugazi Research documented the SIDU governance trap in January 2026. Every subsequent filing has confirmed the original thesis and added to it. The CEO’s private company remains the primary customer and receivables counterparty, and internal controls remain not effective. Two capital raises in six weeks, totaling $158.5M (against $3.4M in annual revenue), extend the runway without addressing the business model.
This is not a new finding; we have published two forensic reports on SIDU establishing the related-party structure, dilution mechanics, and governance failures documented above. The Q1 2026 filings confirm every original thesis pillar, and several have materially worsened.
The Valuation Mismatch
Sidus Space generated $3 million in annual revenue and trades at a $400 million market capitalization, a price-to-sales multiple of 98x. Q1 2026 results show the depth of the disconnect: revenue was just $359K, up 51% year-over-year, but the company reported a net loss of $5.2 million. The company is not scaling; it is burning cash.
Chronic Dilution
In June 2026, Sidus Space announced a $100 million direct offering. The stock sank on the news as each capital raise compresses existing shareholder value. With a valuation of $400 million and a history of failed pivots, Sidus faces a doom loop: it must raise capital to survive, each raise dilutes existing shareholders, and the diluted stock falls further, making the next raise more painful.
The company’s valuation is particularly difficult to justify when viewed through the lens of execution risk. At its current size, even modest commercial setbacks can materially impact financial results, yet the market continues to assign a multiple typically reserved for businesses demonstrating rapid and durable growth. With limited revenue visibility, a history of strategic pivots, and continued reliance on external financing, Sidus remains highly vulnerable to investor sentiment shifting from future potential toward present-day fundamentals.
Source: Sidus Space, Inc. Form 10-Q, Quarter Ended March 31, 2026. Filed May 2026.
Source: Sidus Space, Inc. Form 8-K, $100M Registered Direct Offering Pricing. Filed May 27, 2026.
Source: Sidus Space, Inc. Form 8-K, $58.5M Registered Direct Offering. Filed April 2026.
Momentus Inc. (MNTS)
Momentus has executed three reverse stock splits in thirty months, each to satisfy the same Nasdaq minimum bid requirement, each followed by the same sequence: capital raise, share count explosion, stock price erosion, repeat. The consensus 2026 revenue estimate of $167M requires 15,182% growth from Q1’s annualized run rate, from a company whose primary revenue is described in its own filings as project-based and non-recurring. The dilution engine is the only way for the company to continue surviving.
A space infrastructure story financed primarily through shareholder dilution.
Momentus has attracted investor attention through ambitious projections regarding orbital transportation and space infrastructure services. The underlying financial reality is considerably less impressive. Recent revenue growth has been driven primarily by engineering services, hosted payload contracts, and government-supported activities rather than a scalable commercial platform.
Although the company’s liquidity position improved during 2026, the improvement was largely driven by financing transactions rather than operational success. At the same time, the share count expanded dramatically, diluting existing shareholders at a pace that exceeded underlying business progress.

Above: Timeline of MNTS history of reverse-splits
Momentus also faces a credibility problem common among early-stage space companies: analyst forecasts imply a business that does not yet exist. Consensus revenue estimates assume an acceleration that would require rapid customer adoption, successful execution, and commercialization at a pace rarely achieved within the aerospace industry. Historically, aerospace programs tend to encounter delays, cost overruns, and extended qualification periods. The market appears to be valuing Momentus based on projected future scale rather than demonstrated commercial demand, leaving substantial downside if execution falls short of expectations.
The Reality of the Business
Momentus remains heavily dependent on capital markets to fund operations. Revenue growth has yet to demonstrate the recurring characteristics necessary to justify current expectations, while dilution continues to erode shareholder ownership. Fugazi Research believes the market is assigning a valuation based on future possibilities rather than present business fundamentals.
Source: Momentus Inc. Form 10-Q, Quarter Ended March 31, 2026. Filed May 2026.
Source: Momentus Inc. Form 8-K, 1-for-17.85 Reverse Stock Split. Filed December 15, 2025.
Source: Momentus Inc. Form 8-K, 1-for-14 Reverse Stock Split. Filed December 2024.
Source: Momentus Inc. Press Release, Reverse Stock Split Announcement. December 15, 2025.
Rocket One Inc. (RKTO)
Rocket One is the sector’s most damning data point: a company that received a Nasdaq minimum bid deficiency notice on April 30, filed a going concern disclosure on May 15, announced a space sector rebrand on May 19, and gained 92% in a single session on May 27, all of this without generating a dollar of revenue in any quarter of its existence. The space strategy and pivot are just a press release, and oblivious shareholders will have to ask themselves: What exactly is Rocket One?
A recent corporate rebrand is attempting to capitalize on the space narrative.
Rocket One was known as Hoth Therapeutics until its recent transition into a space-focused company. Prior to the rebrand, the business operated as a development-stage biotechnology company with no meaningful commercial revenue and a substantial accumulated deficit. The company’s new strategy encompasses space infrastructure, AI, semiconductors, and satellite-related technologies despite having limited operating history in any of those industries.
The timing of the transition is equally noteworthy. Rocket One emerged during one of the most speculative periods for both space and AI-related stocks, allowing the company to align with multiple market narratives simultaneously. While thematic enthusiasm can temporarily support valuations, long-term shareholder returns are ultimately driven by revenue, cash flow, and execution. To date, investors have received a strategic vision, but little evidence that the company possesses the assets, technology, customer relationships, or operational infrastructure necessary to compete in any of the industries it now claims to target.
The Narrative Hijack
Rocket One’s valuation appears to be driven primarily by narrative rather than by operating results. The company has not yet demonstrated meaningful participation in the space economy, yet trades as though that transition has already occurred. We believe the company’s recent transformation raises a more fundamental question: if the underlying business were succeeding, why would such a dramatic reinvention be necessary in the first place? Hoth Therapeutics failed to establish a viable commercial biotechnology business, and investors are now being asked to finance an entirely new strategic direction with little evidence that management possesses either the operational experience or competitive advantages required to succeed in the space sector.
Source: Hoth Therapeutics, Inc. Form 8-K, Strategic Repositioning Announcement. Filed May 19, 2026.
Conclusion
The SpaceX IPO has created a halo effect across the publicly traded space sector that bears little resemblance to the fundamentals of the companies benefiting from it. Investors have rewarded businesses with minimal revenue, persistent operating losses, repeated dilution, and unproven business models simply because they operate under the broad umbrella of the space economy. In our view, narrative has overwhelmed analysis.
AST SpaceMobile, Redwire, Virgin Galactic, Sidus Space, Momentus, and Rocket One differ in size, strategy, and market capitalization, but they share the same underlying vulnerabilities: valuations disconnected from current business performance, dependence on external capital, ambitious forward projections, and business models that remain largely unproven at commercial scale. In nearly every case, investors are paying today for revenue, profitability, and execution that may never arrive.
The central flaw in the sector’s investment thesis is the assumption that participation in the space economy is inherently valuable. History suggests otherwise. Railroads, airlines, automobiles, internet infrastructure, clean energy, electric vehicles, and artificial intelligence all experienced periods where investor enthusiasm dramatically exceeded economic reality. The technology often succeeded. Many of the companies did not. In our view, the sector’s current valuations already discount an extraordinarily optimistic future while leaving little room for the delays, dilution, failures, and capital shortages that have historically defined the space industry.
The arrival of SpaceX as a publicly traded company may ultimately accelerate that reckoning. For years, investors seeking exposure to the commercial space industry had few alternatives. Soon, they will have direct access to the dominant launch provider, the dominant satellite operator, and the company responsible for much of the industry’s technological progress. As capital migrates toward the sector’s strongest participant, the speculative premium currently embedded in many secondary and tertiary players may begin to disappear.
In reality, this will be treated like a rocket launch, and rocket launches do not carry the launchpad into orbit. Every dollar of capital that rotates into SPCX is a dollar that no longer needs ASTS as a Starlink proxy, SPCE as a space-tourism concept, SIDU as a satellite manufacturer, MNTS as an orbital-transportation story, RDW as a space-infrastructure roll-up, or RKTO as anything at all. The rocket does not carry the launchpad. It leaves it behind, scorched, inert, and emptied of everything not useful. The six companies in this report are the launchpad.
We believe the publicly traded space sector has become a market in which valuations are driven primarily by aspiration rather than by demonstrated economic value. Fugazi Research considers the publicly traded space sector to be of NO fundamental value.
Disclaimer
The research, commentary, reports, and other materials published by Fugazi Research LLC (“Fugazi Research,” “we,” “us,” or “our,”) are provided solely for informational and educational purposes. Fugazi Research is an independent research publisher and is not registered as an investment adviser, broker-dealer, or commodity trading advisor with the U.S. Securities and Exchange Commission or any other regulatory authority.
All content published by Fugazi Research represents our opinions as of the date of publication and is based on publicly available information, independent research, interviews, and analytical judgment. Our opinions are inherently subjective, may be incomplete, and are subject to change at any time without notice. We do not undertake any obligation to update or revise our content to reflect subsequent events, market developments, or new information.
Nothing published by Fugazi Research constitutes investment advice, financial advice, legal advice, tax advice, or a recommendation to buy, sell, or hold any security or financial instrument. The information should not be construed as tailored to the investment objectives, financial situation, or particular needs of any individual or entity. Readers should conduct their own independent research and consult their own financial, legal, and tax advisors before making any investment decision.
Fugazi Research, its affiliates, principals, members, employees, consultants, or clients may have positions-long, short, or otherwise-in the securities discussed, and such positions may change at any time for any reason, including risk management, market conditions, or liquidity considerations. We may trade in securities covered by our research before, during, or after publication, and we may reduce, close, or reverse positions at any time without notice. Readers should assume that Fugazi Research has a financial interest in the securities discussed.
Our research may include forward-looking statements, estimates, projections, or opinions that involve known and unknown risks, uncertainties, and assumptions. Actual outcomes may differ materially from those expressed or implied. Past performance is not indicative of future results. All investments involve risk, including the potential loss of principal.
While we believe the information we present is accurate and reliable, it is provided “as is” and “as available,” without any representation or warranty, express or implied, as to accuracy, completeness, timeliness, or fitness for any particular purpose. Fugazi Research disclaims any liability for errors, omissions, or losses arising from the use of our content.
By accessing or using Fugazi Research’s materials, you acknowledge and agree that Fugazi Research shall not be liable for any direct, indirect, incidental, consequential, or other losses arising from reliance on our research or opinions. Use of our content is entirely at your own risk.
All content is the intellectual property of Fugazi Research and may not be reproduced, distributed, or shared without prior written consent.
You nailed it!